WebFOCUS and R for Dynamic Statistical Analysis
You can leverage the best of two powerful software products by combining WebFOCUS Business Intelligence language with the R statistical programming
You can leverage the best of two powerful software products by combining WebFOCUS Business Intelligence language with the R statistical programming language.
WebFOCUS from Information Builders provides you with robust BI capabilities such as web access, highly-dynamic scripting, and far-reaching enterprise data access. With the R open-source offering, you have sophisticated statistical analysis, data visualization, and access to web data content.
In this multi-part article, I will show you how easy it is to integrate the two products.
To help explain this, let's look at a simple application where the two products work together.
I have a text analytics software product called the BI Analyzer, which we use in large legacy modernization initiatives as a preliminary assessment tool. The software mines the applications' text for important keywords and loads the scan results into an inventory database--imagine a small Google engine specializing in indexing your custom computer applications--from which WebFOCUS and R can perform analytics.
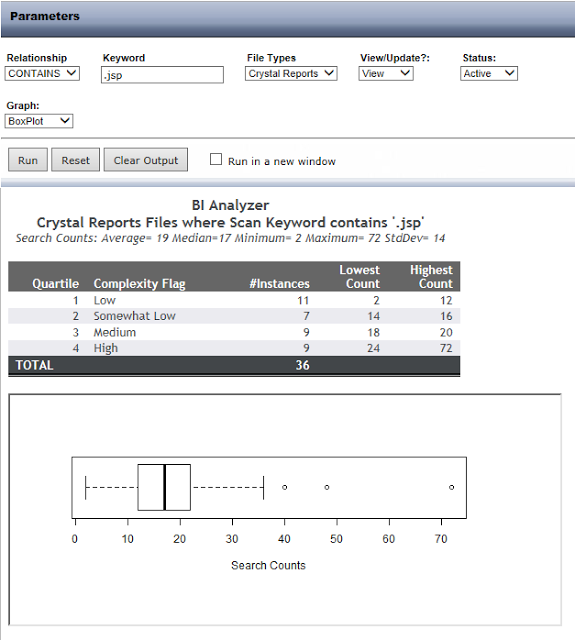
Using statistical analysis, I want to determine the complexity of each scanned procedure. I use WebFOCUS' auto-prompting features to generate a simple user interface of options (if I wanted, I could make this a nicer looking web page, but it meets my needs).
To determine a procedure's complexity, I look at various keywords found inside all of the procedures and, based on their "hit" frequencies, categorize each procedure into one of four buckets: Low, Somewhat Low, Medium, and High.
In addition to showing this breakout in tabular form, I want to display a BoxPlot graph which provides great quartile visualization.
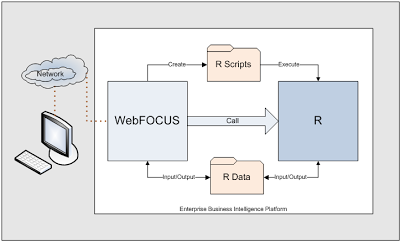
Using the options I choose from the web user interface, WebFOCUS dynamically generates and executes both WebFOCUS and R scripts. It then displays the consolidated results on the web page (again, this is a very simple application to which I could add more presentation sizzle if needed).
Notice in the screenshot that I am searching for any Crystal Reports procedures which use JavaScript Pages (identified by a scanned keyword that contains ".jsp"). I only want to consider those reports which are active, ignoring any in the scanned inventory database which were flagged as obsolete. I'm picking the BoxPlot option but have others such as Histogram and Plot.
WebFOCUS produces a tabular report and then combines it with the R graph.
Had I selected "Update" instead of "View," the procedure would have used the results of its quartile analysis to update the inventory database, flagging each of the scanned procedures referencing JavaScript Pages with its calculated complexity ranking. Later, other reporting features would use this information to calculate time and cost estimates for the legacy BI conversion project.
Here is a summary of what the WebFOCUS procedure does for me:
- Via a web browser, interacts with the user
- Based on the user's selected options, extracts data
- Dynamically builds a WebFOCUS report script based on user's selections
- Runs the script and creates a report
- Dynamically builds an R graph script based on user's selections
- Calls R to run the script and create a graph (using the extracted WebFOCUS data)
- Displays the WebFOCUS and R results on the screen

